

자료실
[논문글쓰기] How to Write a Results Section | Tips & Examples
- 2023-12-19 16:06:30
- hit2968
)
A results section is where you report the main findings of the data collection and analysis you conducted for your thesis or dissertation. You should report all relevant results concisely and objectively, in a logical order. Don’t include subjective interpretations of why you found these results or what they mean—any evaluation should be saved for the discussion section.
How to write a results section
When conducting research, it’s important to report the results of your study prior to discussing your interpretations of it. This gives your reader a clear idea of exactly what you found and keeps the data itself separate from your subjective analysis.
Here are a few best practices:
- Your results should always be written in the past tense.
- While the length of this section depends on how much data you collected and analyzed, it should be written as concisely as possible.
- Only include results that are directly relevant to answering your research questions. Avoid speculative or interpretative words like “appears” or “implies.”
- If you have other results you’d like to include, consider adding them to an appendix or footnotes.
- Always start out with your broadest results first, and then flow into your more granular (but still relevant) ones. Think of it like a shoe store: first discuss the shoes as a whole, then the sneakers, boots, sandals, etc.
Note
In a few fields, including a separate results section is not common practice. In some types of qualitative research, such as ethnographies, the results are often woven together with the discussion. Be sure to check your departmental guidelines for any formatting questions.
Receive feedback on language, structure, and formatting
Professional editors proofread and edit your paper by focusing on:
- Academic style
- Vague sentences
- Grammar
- Style consistency
Reporting quantitative research results
If you conducted quantitative research, you’ll likely be working with the results of some sort of statistical analysis.
Your results section should report the results of any statistical tests you used to compare groups or assess relationships between variables. It should also state whether or not each hypothesis was supported.
The most logical way to structure quantitative results is to frame them around your research questions or hypotheses. For each question or hypothesis, share:
- A reminder of the type of analysis you used (e.g., a two-sample t test or simple linear regression). A more detailed description of your analysis should go in your methodology section.
- A concise summary of each relevant result, both positive and negative. This can include any relevant descriptive statistics (e.g., means and standard deviations) as well as inferential statistics (e.g., t scores, degrees of freedom, and p values). Remember, these numbers are often placed in parentheses.
- A brief statement of how each result relates to the question, or whether the hypothesis was supported. You can briefly mention any results that didn’t fit with your expectations and assumptions, but save any speculation on their meaning or consequences for your discussion and conclusion.
Tip
The statistics you report (and the conventions for presenting them) depend both on the type of analysis you conducted and the style guide you are following. For example, there are specific rules for writing a results section in APA Style.
If you’re unsure, read the results sections of other papers in your field. This can help you get a clear sense of what information to include.
A note on tables and figures
In quantitative research, it’s often helpful to include visual elements such as graphs, charts, and tables, but only if they are directly relevant to your results. Give these elements clear, descriptive titles and labels so that your reader can easily understand what is being shown. If you want to include any other visual elements that are more tangential in nature, consider adding a figure and table list.
As a rule of thumb:
- Tables are used to communicate exact values, giving a concise overview of various results
- Graphs and charts are used to visualize trends and relationships, giving an at-a-glance illustration of key findings
Don’t forget to also mention any tables and figures you used within the text of your results section. Summarize or elaborate on specific aspects you think your reader should know about rather than merely restating the same numbers already shown.
Example: Reporting survey results
A two-sample t test was used to test the hypothesis that higher social distance from environmental problems would reduce the intent to donate to environmental organizations, with donation intention (recorded as a score from 1 to 10) as the outcome variable and social distance (categorized as either a low or high level of social distance) as the predictor variable.Social distance was found to be positively correlated with donation intention, t(98) = 12.19, p < .001, with the donation intention of the high social distance group 0.28 points higher, on average, than the low social distance group (see figure 1). This contradicts the initial hypothesis that social distance would decrease donation intention, and in fact suggests a small effect in the opposite direction.
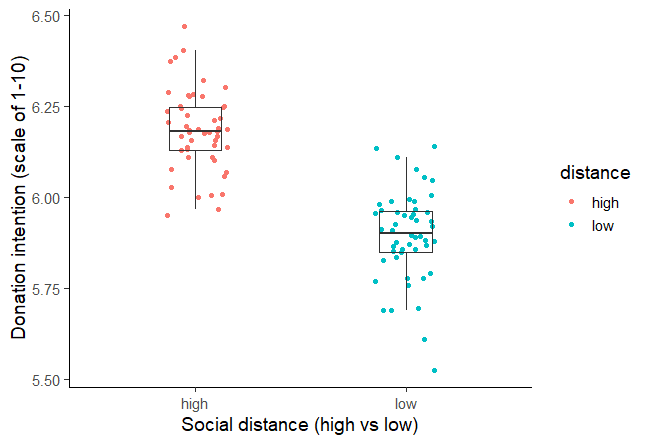
Figure 1: Intention to donate to environmental organizations based on social distance from impact of environmental damage.
Reporting qualitative research results
In qualitative research, your results might not all be directly related to specific hypotheses. In this case, you can structure your results section around key themes or topics that emerged from your analysis of the data.
For each theme, start with general observations about what the data showed. You can mention:
- Recurring points of agreement or disagreement
- Patterns and trends
- Particularly significant snippets from individual responses
Next, clarify and support these points with direct quotations. Be sure to report any relevant demographic information about participants. Further information (such as full transcripts, if appropriate) can be included in an appendix.
Example: Reporting interview results
When asked about video games as a form of art, the respondents tended to believe that video games themselves are not an art form, but agreed that creativity is involved in their production. The criteria used to identify artistic video games included design, story, music, and creative teams.One respondent (male, 24) noted a difference in creativity between popular video game genres:
“I think that in role-playing games, there’s more attention to character design, to world design, because the whole story is important and more attention is paid to certain game elements […] so that perhaps you do need bigger teams of creative experts than in an average shooter or something.”
Responses suggest that video game consumers consider some types of games to have more artistic potential than others.
Results vs. discussion vs. conclusion
Your results section should objectively report your findings, presenting only brief observations in relation to each question, hypothesis, or theme.
It should not speculate about the meaning of the results or attempt to answer your main research question. Detailed interpretation of your results is more suitable for your discussion section, while synthesis of your results into an overall answer to your main research question is best left for your conclusion.

주소 : 서울시 강남구 청담동 41번지 청담빌딩 5층 | 대표번호 : 02-554-0805 | 고객센터 : 1899-0805
E-mail: info15@brainphd.co.kr | 개인정보관리책임자 : 김동효
저작권 (c) brainphd.co.kr 가 판권을 소유함.


