

자료실
[유용한TIP] Types of Variables in Research & Statistics | Examples
- 2025-02-07 15:28:00
- hit3519
)
In statistical research, a variable is defined as an attribute of an object of study. Choosing which variables to measure is central to good experimental design.
Example
If you want to test whether some plant species are more salt-tolerant than others, some key variables you might measure include the amount of salt you add to the water, the species of plants being studied, and variables related to plant health like growth and wilting.
You need to know which types of variables you are working with in order to choose appropriate statistical tests and interpret the results of your study.
You can usually identify the type of variable by asking two questions:
-
What type of data does the variable contain?
-
What part of the experiment does the variable represent?
Types of data: Quantitative vs categorical variables
Data is a specific measurement of a variable – it is the value you record in your data sheet. Data is generally divided into two categories:
-
Quantitative data represents amounts
-
Categorical data represents groupings
A variable that contains quantitative data is a quantitative variable; a variable that contains categorical data is a categorical variable. Each of these types of variables can be broken down into further types.
Quantitative variables
When you collect quantitative data, the numbers you record represent real amounts that can be added, subtracted, divided, etc. There are two types of quantitative variables: discrete and continuous.
Categorical variables
Categorical variables represent groupings of some kind. They are sometimes recorded as numbers, but the numbers represent categories rather than actual amounts of things.
There are three types of categorical variables: binary, nominal, and ordinal variables.
Binary vs nominal vs ordinal variables
Note that sometimes a variable can work as more than one type! An ordinal variable can also be used as a quantitative variable if the scale is numeric and doesn’t need to be kept as discrete integers. For example, star ratings on product reviews are ordinal (1 to 5 stars), but the average star rating is quantitative.
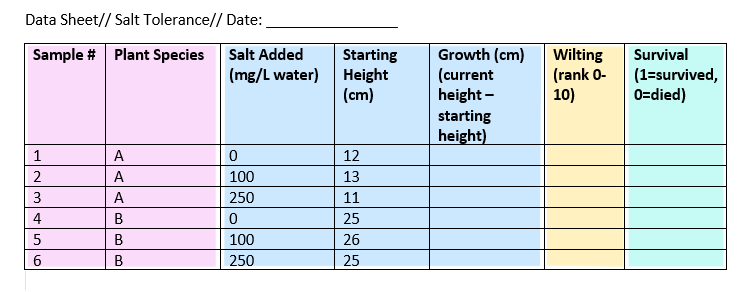
Example data sheet
To keep track of your salt-tolerance experiment, you make a data sheet where you record information about the variables in the experiment, like salt addition and plant health.
To gather information about plant responses over time, you can fill out the same data sheet every few days until the end of the experiment. This example sheet is color-coded according to the type of variable: nominal, continuous, ordinal, and binary.
Parts of the experiment: Independent vs dependent variables
Experiments are usually designed to find out what effect one variable has on another – in our example, the effect of salt addition on plant growth.
You manipulate the independent variable (the one you think might be the cause) and then measure the dependent variable (the one you think might be the effect) to find out what this effect might be.
You will probably also have variables that you hold constant (control variables) in order to focus on your experimental treatment.
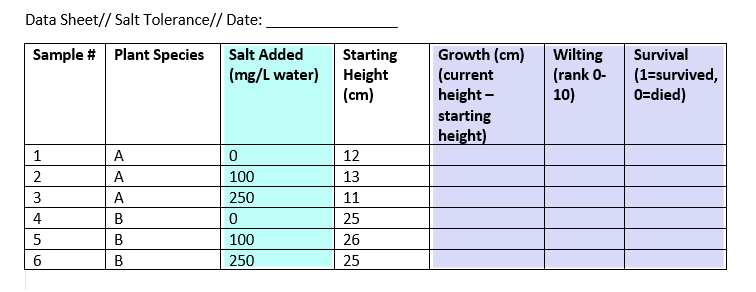
Independent vs dependent vs control variables
- Example data sheet
In this experiment, we have one independent and three dependent variables.
The other variables in the sheet can’t be classified as independent or dependent, but they do contain data that you will need in order to interpret your dependent and independent variables.
What about correlational research?
When you do correlational research, the terms “dependent” and “independent” don’t apply, because you are not trying to establish a cause and effect relationship (causation).
However, there might be cases where one variable clearly precedes the other (for example, rainfall leads to mud, rather than the other way around). In these cases you may call the preceding variable (i.e., the rainfall) the predictor variable and the following variable (i.e. the mud) the outcome variable.
Other common types of variables
Once you have defined your independent and dependent variables and determined whether they are categorical or quantitative, you will be able to choose the correct statistical test.
But there are many other ways of describing variables that help with interpreting your results. Some useful types of variables are listed below.
|
What are independent and dependent variables? You can think of independent and dependent variables in terms of cause and effect: an independent variable is the variable you think is the cause, while a dependent variable is the effect. In an experiment, you manipulate the independent variable and measure the outcome in the dependent variable. For example, in an experiment about the effect of nutrients on crop growth:
Defining your variables, and deciding how you will manipulate and measure them, is an important part of experimental design.
What is a confounding variable? A confounding variable, also called a confounder or confounding factor, is a third variable in a study examining a potential cause-and-effect relationship. A confounding variable is related to both the supposed cause and the supposed effect of the study. It can be difficult to separate the true effect of the independent variable from the effect of the confounding variable. In your research design, it’s important to identify potential confounding variables and plan how you will reduce their impact.
What is the difference between quantitative and categorical variables? Quantitative variables are any variables where the data represent amounts (e.g. height, weight, or age). Categorical variables are any variables where the data represent groups. This includes rankings (e.g. finishing places in a race), classifications (e.g. brands of cereal), and binary outcomes (e.g. coin flips). You need to know what type of variables you are working with to choose the right statistical test for your data and interpret your results.
What is the difference between discrete and continuous variables? Discrete and continuous variables are two types of quantitative variables:
|
Bevans, R. (2023, June 21). Types of Variables in Research & Statistics | Examples. Scribbr. Retrieved July 9, 2024, from https://www.scribbr.com/methodology/types-of-variables/
논문과 관련하여 도움이 필요한 경우 친절하게 상담하고 있으니 편한 마음으로, 전화, 홈페이지, 카톡, 톡톡 등을 통해 상담을 받아보세요~
대표번호 : 02-554-0805
고객센터 : 1899-0805
24시간카톡상담 : brainphd
이메일 : info5044@brainphd.co.kr
#Article #Research #Paper #논문컨설팅 #석사논문 #박사논문 #공학논문 #사회복지논문 #건축학논문 #서울대박사 #논문통계 #SPSS #SCI논문 #학위논문 #논문교정 #부산논문 #대전논문 #간호학논문 #경영학논문 #마케팅논문 #음악논문 #미술논문 #교육학논문 #심리학논문 #의학논문

주소 : 서울시 강남구 청담동 41번지 청담빌딩 5층 | 대표번호 : 02-554-0805 | 고객센터 : 1899-0805
E-mail: info15@brainphd.co.kr | 개인정보관리책임자 : 김동효
저작권 (c) brainphd.co.kr 가 판권을 소유함.


