

자료실
[유용한TIP] How to Find the Geometric Mean | Calculator & Formula
- 2025-03-23 17:34:00
- hit4765
)
The geometric mean is an average that multiplies all values and finds a root of the number. For a dataset with n numbers, you find the nth root of their product. You can use this descriptive statistic to summarize your data.
The geometric mean is an alternative to the arithmetic mean, which is often referred to simply as “the mean.” While the arithmetic mean is based on adding values, the geometric mean multiplies values.
Geometric mean calculator
You can calculate the geometric mean by hand or with the help of our geometric mean calculator below.
Geometric mean formula
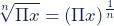
The geometric mean formula can be written in two ways, but they are equivalent mathematically.
-
 = product of …
 -
 = every value
 -
 = total number of values
 -
 = reciprocal of
The symbol pi () is similar to the summation sign sigma (Σ), but instead it tells you to find the product of what follows after it by multiplying them all together.
In the first formula, the geometric mean is the nth root of the product of all values.
In the second formula, the geometric mean is the product of all values raised to the power of the reciprocal of n.
These formulas are equivalent because of the laws of exponents: taking the nth root of x is exactly the same as raising x to the power of 1/n.
Calculating the geometric mean
There are two main steps to calculating the geometric mean:
-
Multiply all values together to get their product.
-
Find the nth root of the product (n is the number of values).
Before calculating this measure of central tendency, note that:
-
The geometric mean can only be found for positive values.
-
If any value in the dataset is zero, the geometric mean is zero.
When should you use the geometric mean?
The geometric mean is best for reporting average inflation, percentage change, and growth rates. Because these types of data are expressed as fractions, the geometric mean is more accurate for them than the arithmetic mean.
While the arithmetic mean is appropriate for values that are independent from each other (e.g., test scores), the geometric mean is more appropriate for dependent values, percentages, fractions, or widely ranging data.
We’ll walk you through some examples showing how to find the geometric means of different types of data.
Example: Geometric mean of percentages
You’re interested in the average voter turnout of the past five US elections. You’ve gathered the following data.
|
Year |
2000 |
2004 |
2008 |
2012 |
2016 |
|
Voter turnout (%) |
50.3 |
55.7 |
57.1 |
54.9 |
60.1 |
Step 1: Multiply all values together to get their product.
|
Formula |
Calculation |
|
|
|


Step 2: Find the nth root of the product (n is the number of values).
|
Formula |
Calculation |
|
|
|


The average voter turnout of the past five US elections was 54.64%.
Example: Geometric mean of widely varying values
You compare the efficiency of two machines for three procedures that are assessed on different scales. To find the mean efficiency of each machine, you find the geometric and arithmetic means of their procedure rating scores.
|
|
Procedure 1 |
Procedure 2 |
Procedure 3 |
|
Machine A |
7 |
80 |
2100 |
|
Machine B |
3 |
94 |
2350 |
Geometric mean of Machine A
Step 1: Multiply all values together to get their product.
|
Formula |
Calculation |
|
|
|

Step 2: Find the nth root of the product (n is the number of values).
|
Formula |
Calculation |
|
|
|


Geometric mean of Machine B
Step 1: Multiply all values together to get their product.
|
Formula |
Calculation |
|
|
|

Step 2: Find the nth root of the product (n is the number of values).
|
Formula |
Calculation |
|
|
|


Comparing the means
Now you compare machine efficiency using arithmetic and geometric means.
|
|
Arithmetic mean |
Geometric mean |
|
Machine A |
729 |
105.55 |
|
Machine B |
815.67 |
87.18 |
While the arithmetic means show higher efficiency for Machine B, the geometric means show that Machine B is more efficient.
The geometric mean is more accurate here because the arithmetic mean is skewed towards values that are higher than most of your dataset.
Geometric mean vs. arithmetic mean
The geometric mean is more accurate than the arithmetic mean for showing percentage change over time or compound interest.
For example, say you study fruit fly population growth rates. You’re interested in understanding how environmental factors change these rates.
You begin with 2 fruit flies, and every 12 days you measure the percentage increase in the population.
Each percentage change value is also converted into a growth factor that is in decimals. The growth factor includes the original value (100%), so to convert percentage increase into a growth factor, add 100 to each percentage increase and divide by 100.
|
Day |
12 |
24 |
36 |
|
Percentage increase |
340 |
187 |
427 |
|
Growth factor |
4.4 |
2.87 |
5.27 |
First, you convert percentage change into decimals. You add 100 to each value to factor in the original amount, and divide each value by 100.
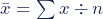
Arithmetic mean
To find the arithmetic mean, add up all values and divide this number by n.
|
Formula |
Calculation |
|
|
|


Geometric mean
Step 1: Multiply all values together to get their product.
|
Formula |
Calculation |
|
|
|

Step 2: Find the nth root of the product (n is the number of values).
|
Formula |
Calculation |
|
|
|


The arithmetic mean population growth factor is 4.18, while the geometric mean growth factor is 4.05.
How do we know which mean is correct?
Because they are averages, multiplying the original number of flies with the mean percentage change 3 times should give us the correct final population value for the correct mean.
-
Final population value: 2 × 4.4 × 2.87 × 5.27 ≈ 133 fruit flies
-
Arithmetic mean of 418%: Final population = 2 × 4.18 × 4.18 × 4.18 ≈ 157 fruit flies
-
Geometric mean of 405%: Final population = 2 × 4.05 × 4.05 × 4.05 ≈ 133 fruit flies
Only the geometric mean gives us the true number of fruit flies in the final population. It’s the most accurate mean for the growth factor.
When is the geometric mean better than the arithmetic mean?
Even though it’s less commonly used, the geometric mean is more accurate than the arithmetic mean for positively skewed data and percentages.
In a positively skewed distribution, there’s a cluster of lower scores and a spread-out tail on the right. Income distribution is a common example of a skewed dataset.
While most values tend to be low, the arithmetic mean is often pulled upward (or rightward) by high values or outliers in a positively skewed dataset.
Because the geometric mean tends to be lower than the arithmetic mean, it represents smaller values better than the arithmetic mean.
The geometric mean is most appropriate for ratio levels of measurement, where variables have a true zero and don’t take on any negative values. Negative percentage changes have to be framed positively: for instance, −8% becomes 92% of the original value.
Frequently asked questions about central tendency
|
How do I calculate the geometric mean? There are two steps to calculating the geometric mean:
Before calculating the geometric mean, note that:
What’s the difference between the arithmetic and geometric means? The arithmetic mean is the most commonly used type of mean and is often referred to simply as “the mean.” While the arithmetic mean is based on adding and dividing values, the geometric mean multiplies and finds the root of values. Even though the geometric mean is a less common measure of central tendency, it’s more accurate than the arithmetic mean for percentage change and positively skewed data. The geometric mean is often reported for financial indices and population growth rates.
What are measures of central tendency? Measures of central tendency help you find the middle, or the average, of a data set. The 3 most common measures of central tendency are the mean, median and mode.
|
Bhandari, P. (2023, June 21). How to Find the Geometric Mean | Calculator & Formula. Scribbr. Retrieved August 5, 2024, from https://www.scribbr.com/statistics/geometric-mean/
논문과 관련하여 도움이 필요한 경우 친절하게 상담하고 있으니 편한 마음으로, 전화, 홈페이지, 카톡, 톡톡 등을 통해 상담을 받아보세요~
대표번호 : 02-554-0805
고객센터 : 1899-0805
24시간카톡상담 : brainphd
이메일 : info5044@brainphd.co.kr
#Article #Research #Paper #논문컨설팅 #석사논문 #박사논문 #공학논문 #사회복지논문 #건축학논문 #서울대박사 #논문통계 #SPSS #SCI논문 #학위논문 #논문교정 #부산논문 #대전논문 #간호학논문 #경영학논문 #마케팅논문 #음악논문 #미술논문 #교육학논문 #심리학논문 #의학논문

주소 : 서울시 강남구 청담동 41번지 청담빌딩 5층 | 대표번호 : 02-554-0805 | 고객센터 : 1899-0805
E-mail: info15@brainphd.co.kr | 개인정보관리책임자 : 김동효
저작권 (c) brainphd.co.kr 가 판권을 소유함.


